Mathematics Class VI Statistics Bar Graphs
unknown
Q. The bar graph given below shows the population of a particular city from 1996 to 2016. Read the bar graph carefully and answer the question :
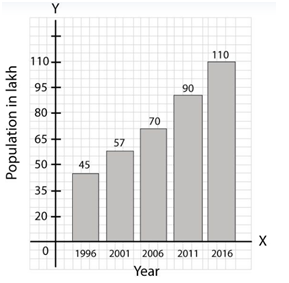
In which year was the population of the city maximum and what was the population?
Q. The bar graph given below shows the population of a particular city from 1996 to 2016. Read the bar graph carefully and answer the question :
What was the increase in population from 1996 to 2016?
Q. The bar graph given below shows the population of a particular city from 1996 to 2016. Read the bar graph carefully and answer the question :
In which year was the population half that of 2011?
OTHER CLASS VI TOPICS
Algebraic Expressions
Decimals
Fractions
Geometry
Integers
Knowing our Numbers
Linear Equations
Number System
Percentage
Perimeter
Polynomials
Profit and Loss
Ratio and Proportion
Statistics
Substitution
Triangles
Whole Numbers